
This year, we have overhauled the entire variable framework—or rather, we are still in the process of doing so. At the same time, the status pages are being redesigned and will now also replace the time reports. Daily email reports will follow.
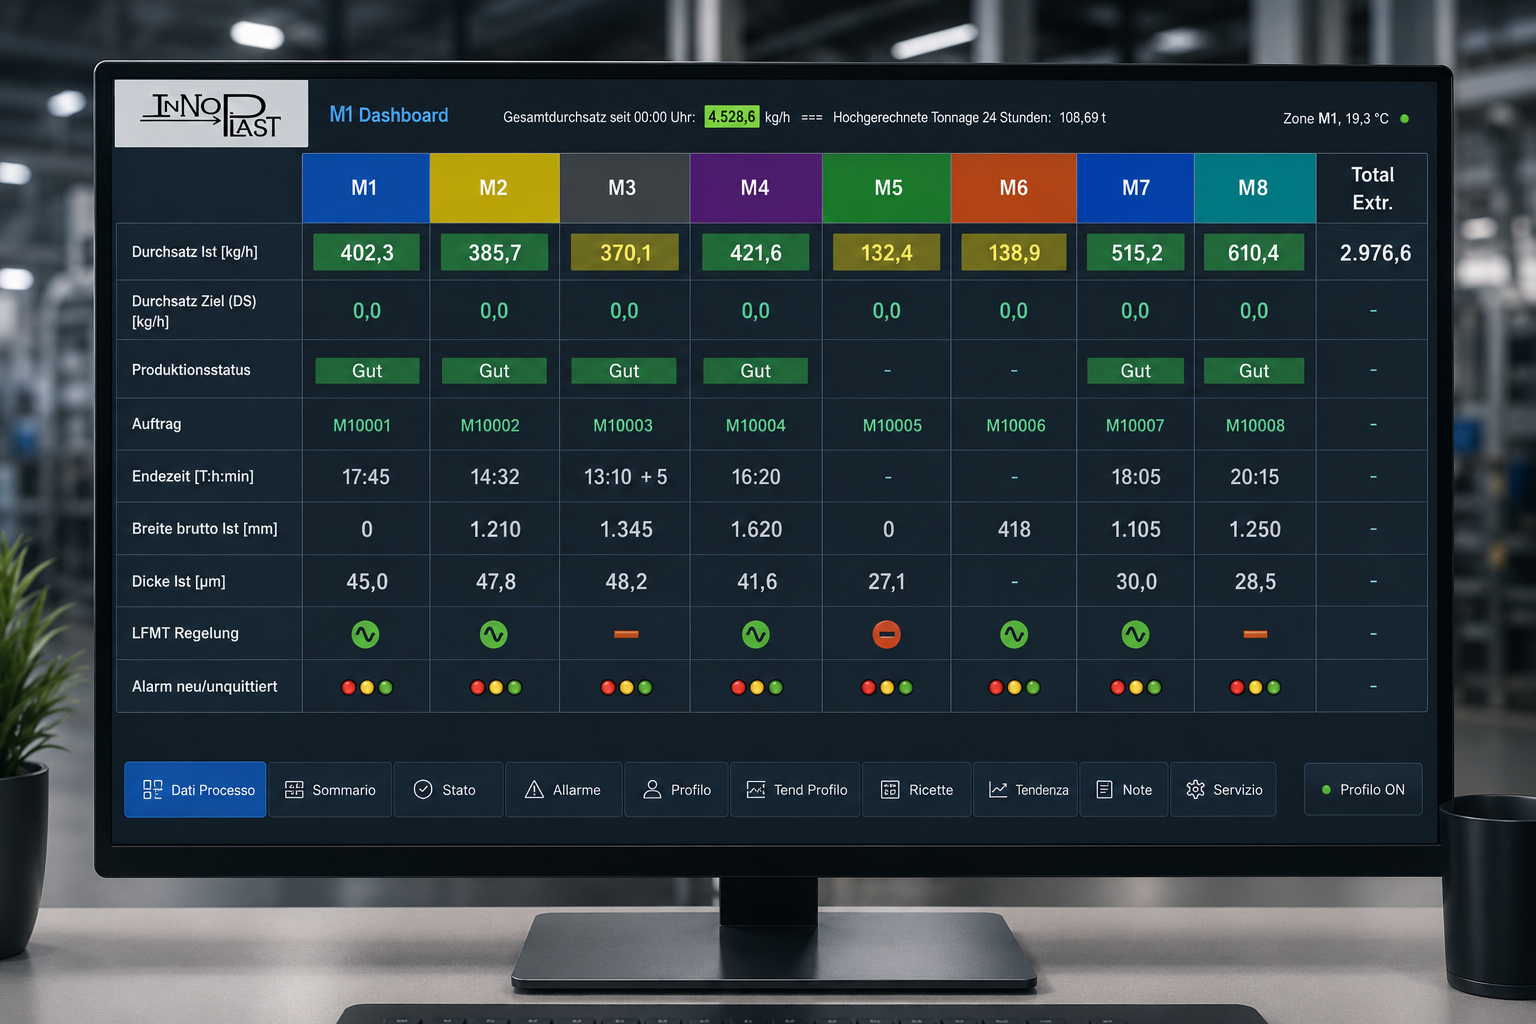
This allows us to configure the process data you want to see on your system with relative freedom. Columns or rows? Locations separated or grouped? Combining current data with report data (such as integrating production since the start of the shift into the status)? Not a problem.
In addition, the different machine types were redefined and corresponding grouping aids were created. This makes it easier to control, individually for each installation, how different machine types (extrusion, converting, reprocessing, mixers, …) are displayed.
The popular color switching for throughputs is now also available for meters (i.e., m/min), pieces/minute (converting machines), or energy data (if recorded).
Further implemented functionalities include good/bad production for assessing scrap quantities, automatic calculation of planned figures, and a setpoint report that divides an order into time segments with identical setpoints. This makes it easy to analyze when, for example, the format, output, or silo material was changed within an order.
In terms of connectivity, we have implemented an OPC/UA interface that provides selected process data.
Would you like to know how webMIP can be integrated into your system?
Get in touch with us without obligation.